


We study unlearnability in reinforcement learning (RL) tasks for language models. We find that
High resolution clearly splits learned and stuck tasks
Which tasks remain stuck is reproducible across training runs
The hardest tasks are learned, just slowly
Tasks the base model never solves still get learned
Tasks that look unlearnable might just be lacking enough correct rollouts
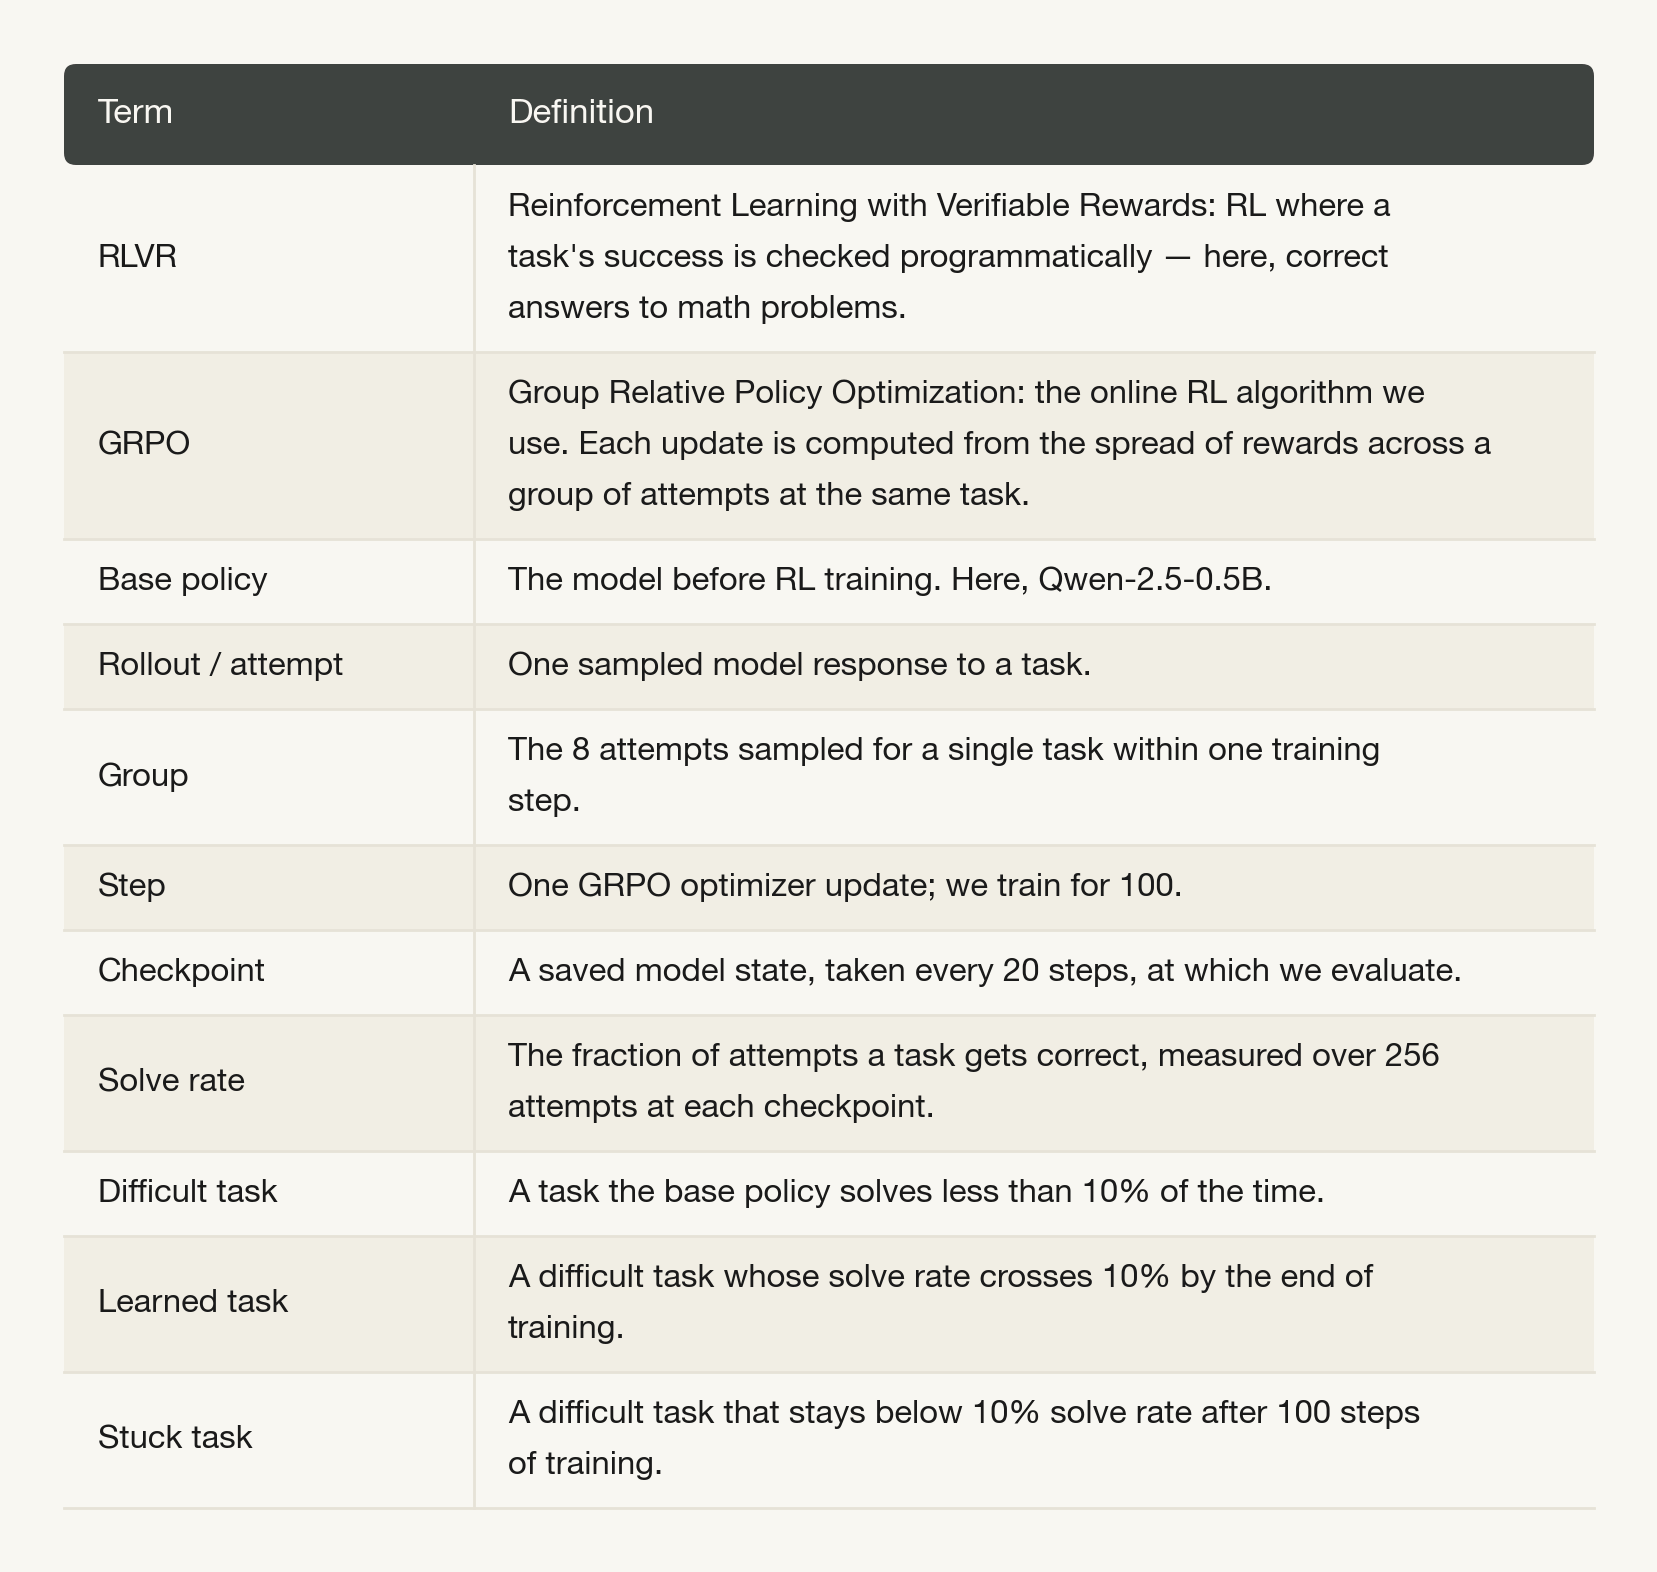
Definitions
Introduction
Choosing tasks for RL training requires some estimate of what a model can learn from them. A task the model rarely solves may become reliably solvable after training or it may remain stuck through the entire run. Understanding this difference could help us choose tasks that contribute to learning and identify those that need a different training approach. We would like to predict which outcome a task will reach before spending the compute to find out.
Recent work on “unlearnability” made this question more concrete by identifying math tasks that remain poorly solved after RL, even under several interventions intended to help them learn [1]. They attribute this behavior to a gap in the model’s representations. Interpreting that result requires separating a prompt’s response to training from its starting difficulty and the uncertainty in how we measure it. A task may appear stuck because it is exceptionally hard, because too few attempts were sampled to detect improvement or because something about the prompt and model consistently limits learning.
We investigate these problems and find a persistent task-level failure to learn, which withstands the rigor of a large sampling regime. We use a high-resolution investigation to ask some questions about unlearnability in RLVR:
Does a persistent stuck population remain when performance is measured with more attempts?
How much of the difference between learned and stuck tasks does starting difficulty explain?
What distinguishes tasks that eventually learn from equally difficult tasks that remain stuck?
Background
In reinforcement learning with verifiable rewards, a program scores the model’s responses. Here, the responses are attempted solutions to math problems, and the reward parser checks their final answers. We use Group Relative Policy Optimization, or GRPO [2], which compares rewards across several responses to the same prompt.
When all responses in a group receive the same reward, their relative reward advantages are zero. That group supplies no reward-based policy-gradient signal. Dynamic sampling [3] responds to this by discarding groups with uniform rewards; difficulty-filtering methods [4] use estimated pass rates to select prompts that can produce a useful mix of outcomes. Other loss terms, such as KL and entropy terms, are separate from this reward-based signal.
The absence of signal in one group does not determine what happens over a training run. Updates from other prompts can change the model’s ability to solve this one. Conversely, producing an occasional correct answer does not guarantee substantial improvement. Curriculum research [5, 6] motivates the first possibility, while Chen et al.’s results [1] raise the second.
Measurement complicates both cases. Chakma et al. [7] show that finite rollout budgets can change which prompts receive difficulty-based labels, while retaining evidence of slow learning. We therefore measure the same prompts repeatedly at a larger rollout budget and compare their outcomes across runs.
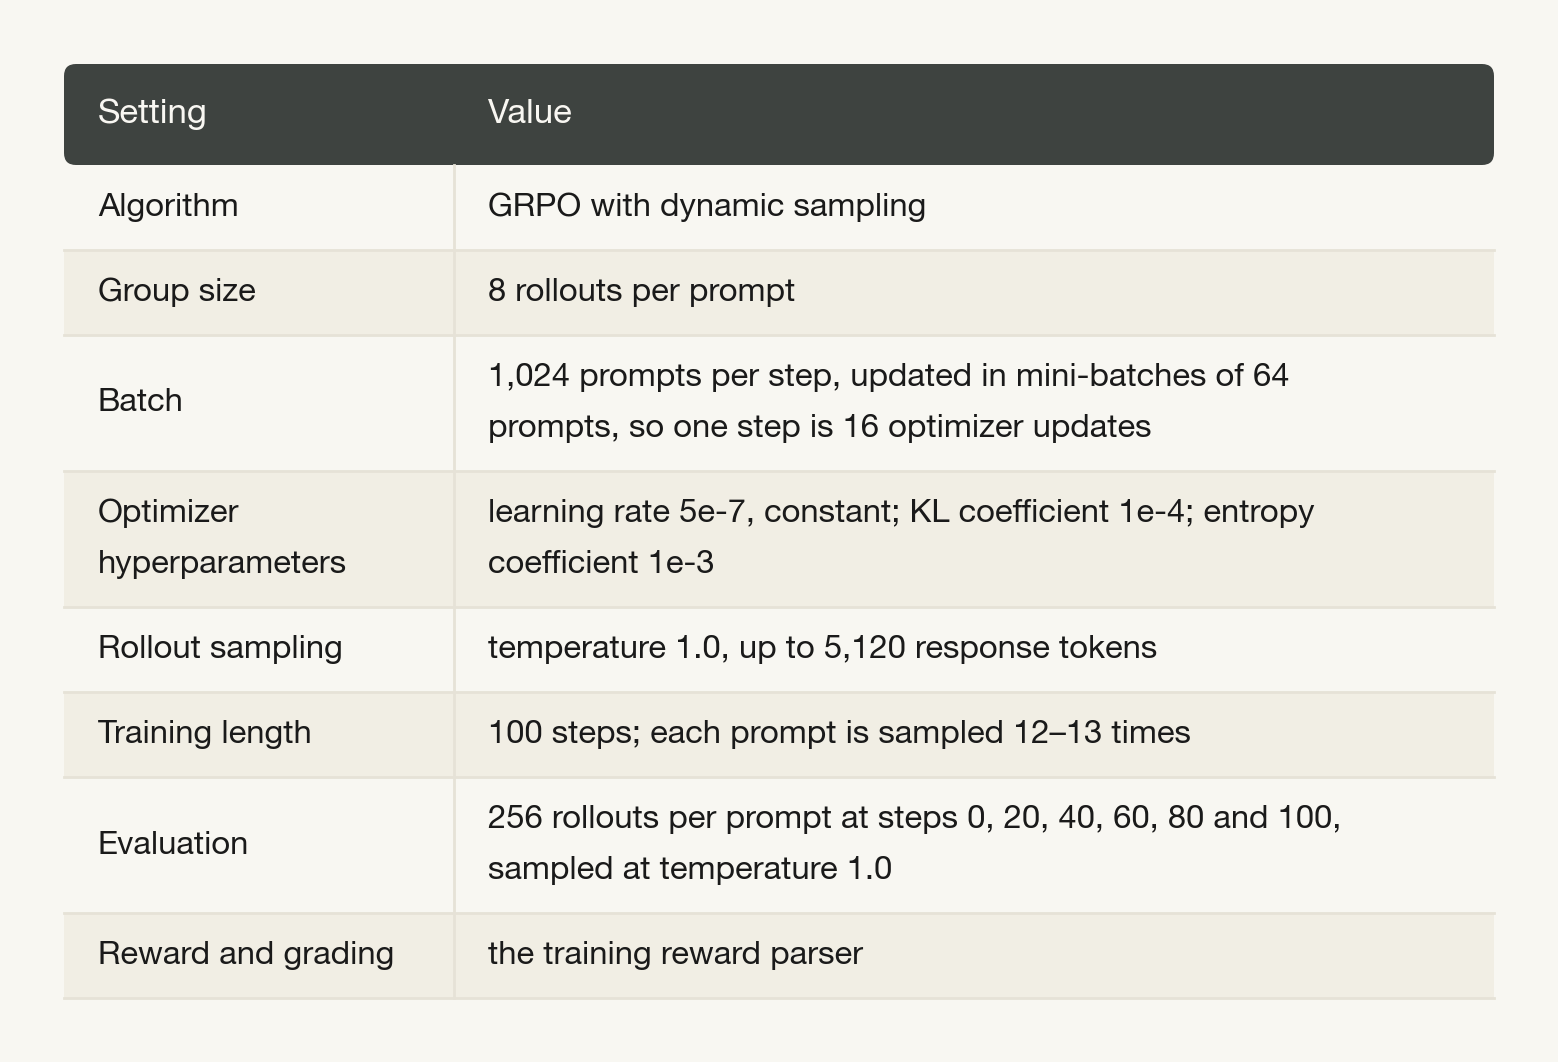
We train Qwen-2.5-0.5B for 100 GRPO steps on all 8,139 MATH training problems at levels 1-4. During training, the model is given 8 attempts per prompt and 1024 prompts per step. We repeat across 2 seeds to study reproducibility of learning dynamics; in each run, each task is seen 12-13 times, determined only by random task ordering.
What changes when we measure difficulty with more attempts
We call a task “difficult” if its base success rate is less than 10%. A difficult task is “learned” if the success rate at step 100 of GRPO exceeds 10% and it is “stuck” otherwise. With 8 attempts for a task, the threshold falls below success rate of 10%, for only 0 correct attempts out of 8. With 256 rollouts, the threshold falls between 25 and 26 correct attempts.
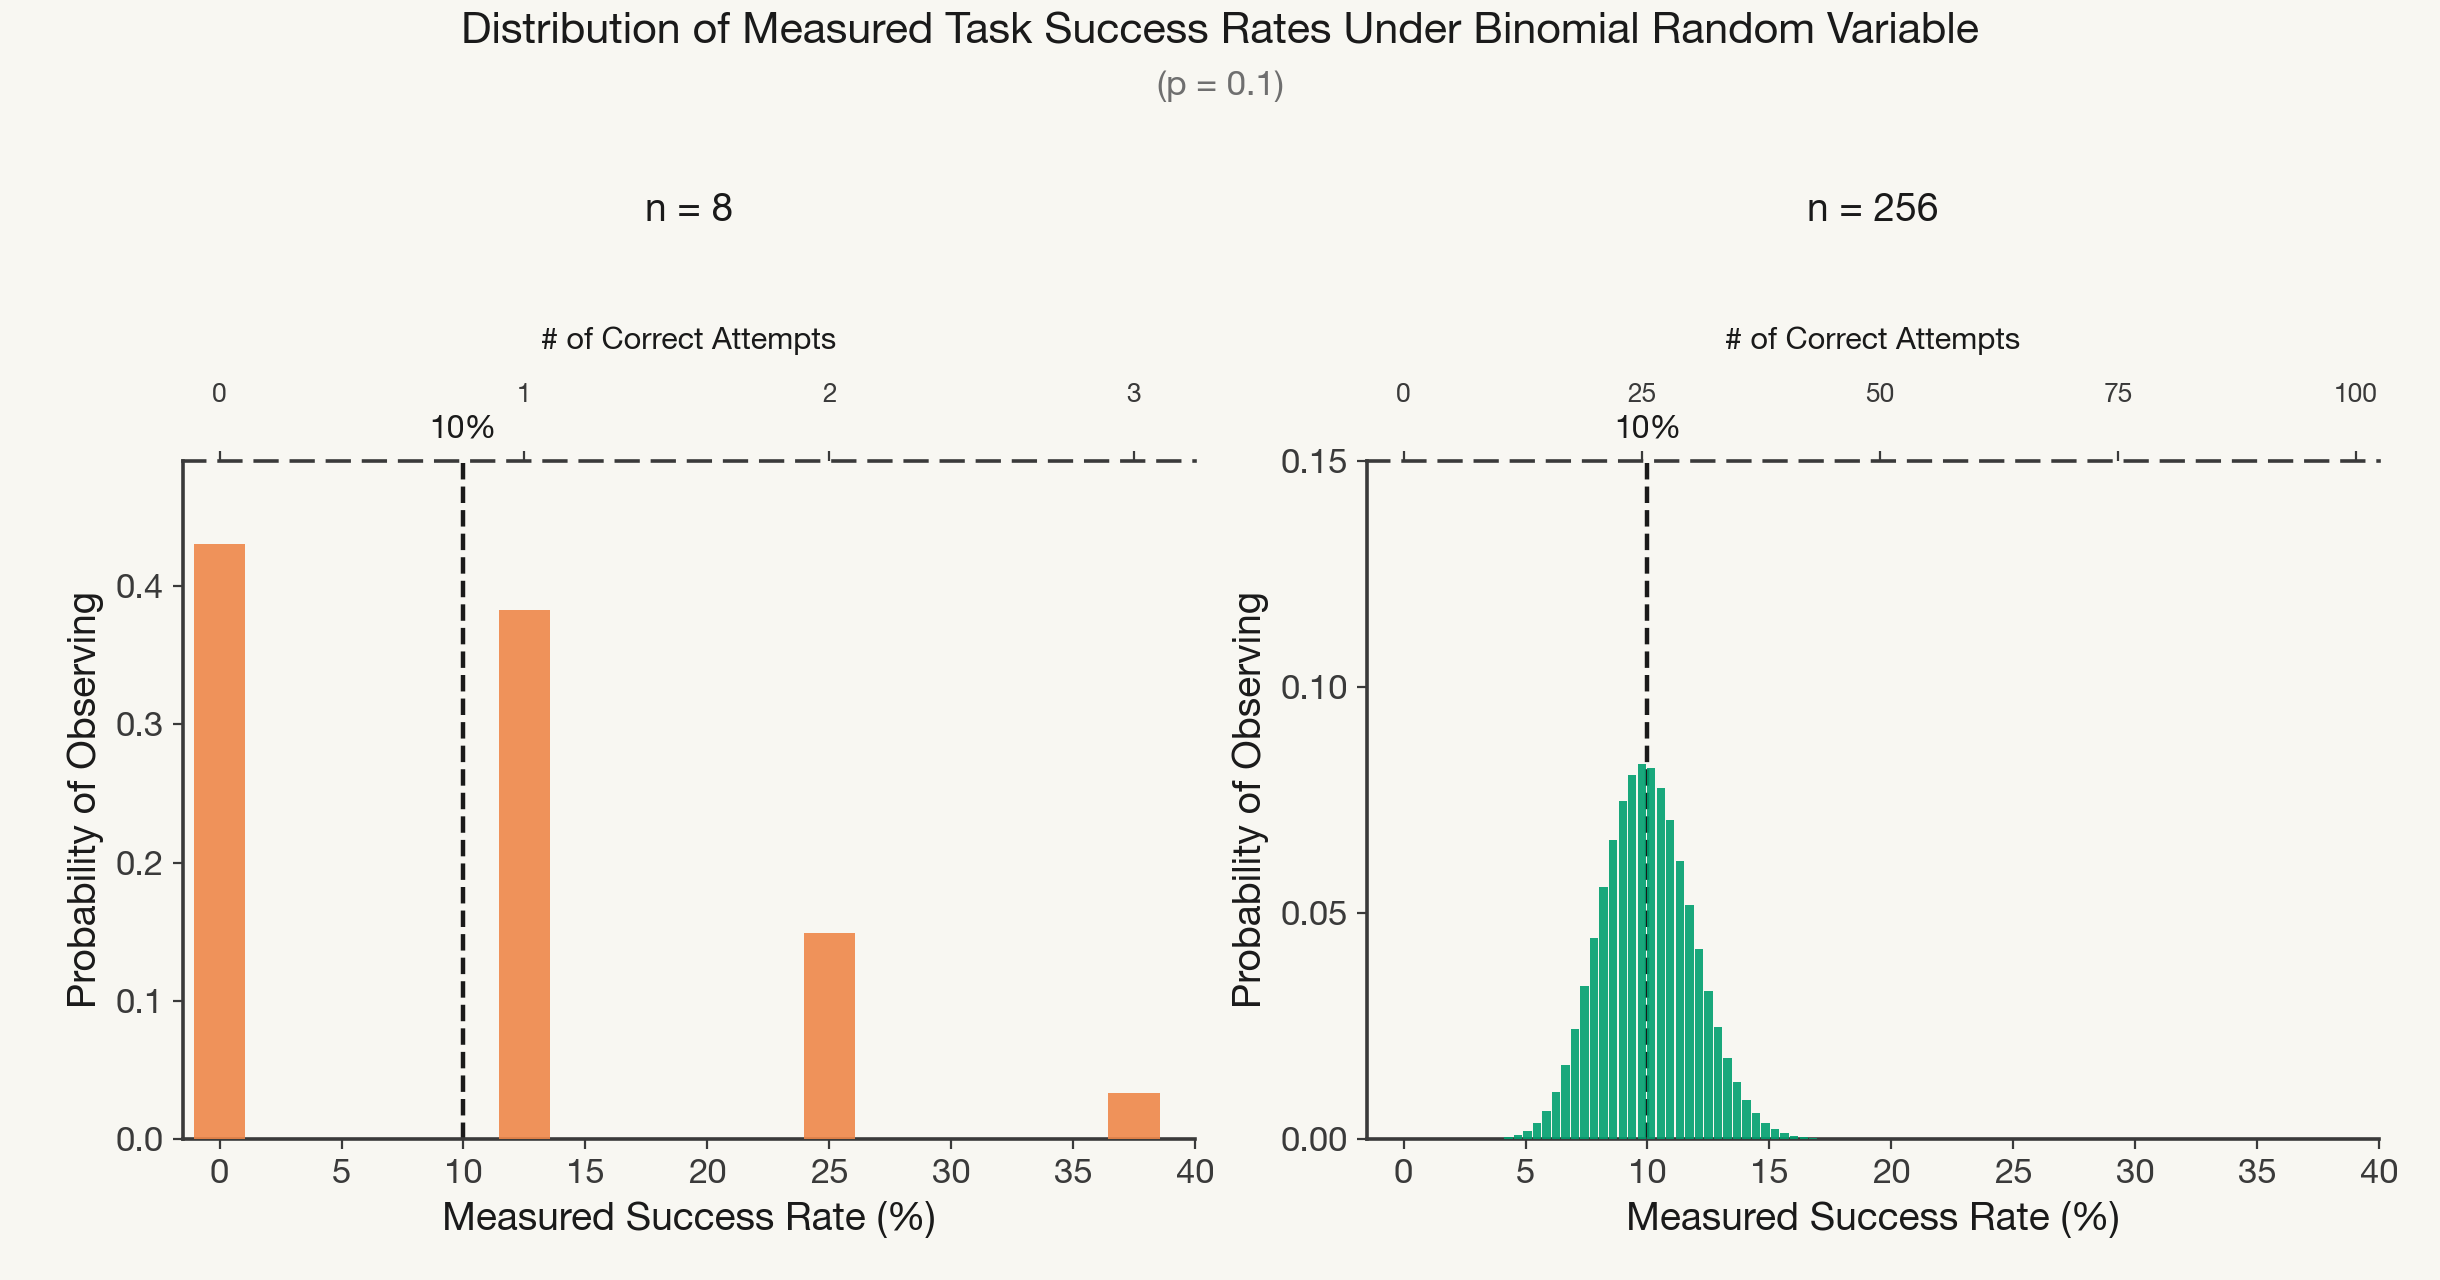
Sampling distribution for a task whose true success rate is exactly 10%, assuming independent probability of success across samples. We show where the measured rate lands at n=8 vs n=256 samples.
Assuming 10% true probability of success per attempt, estimation using 8 samples leaves you with 0.43 probability of observing 0 correct attempts. With 256 samples this probability drops to 1e-12. This is the measurement concern Chakma et al. [7] formalize as a sampling-budget problem; we take the higher-resolution view it motivates.
35% of difficult tasks never cross 10% success rate across 256 attempts, after 100 steps of training. There is a clear bimodal split among tasks that start at less than 10% solve rate, where some improve beyond that threshold (even up to 100%) and some stay entirely stuck.
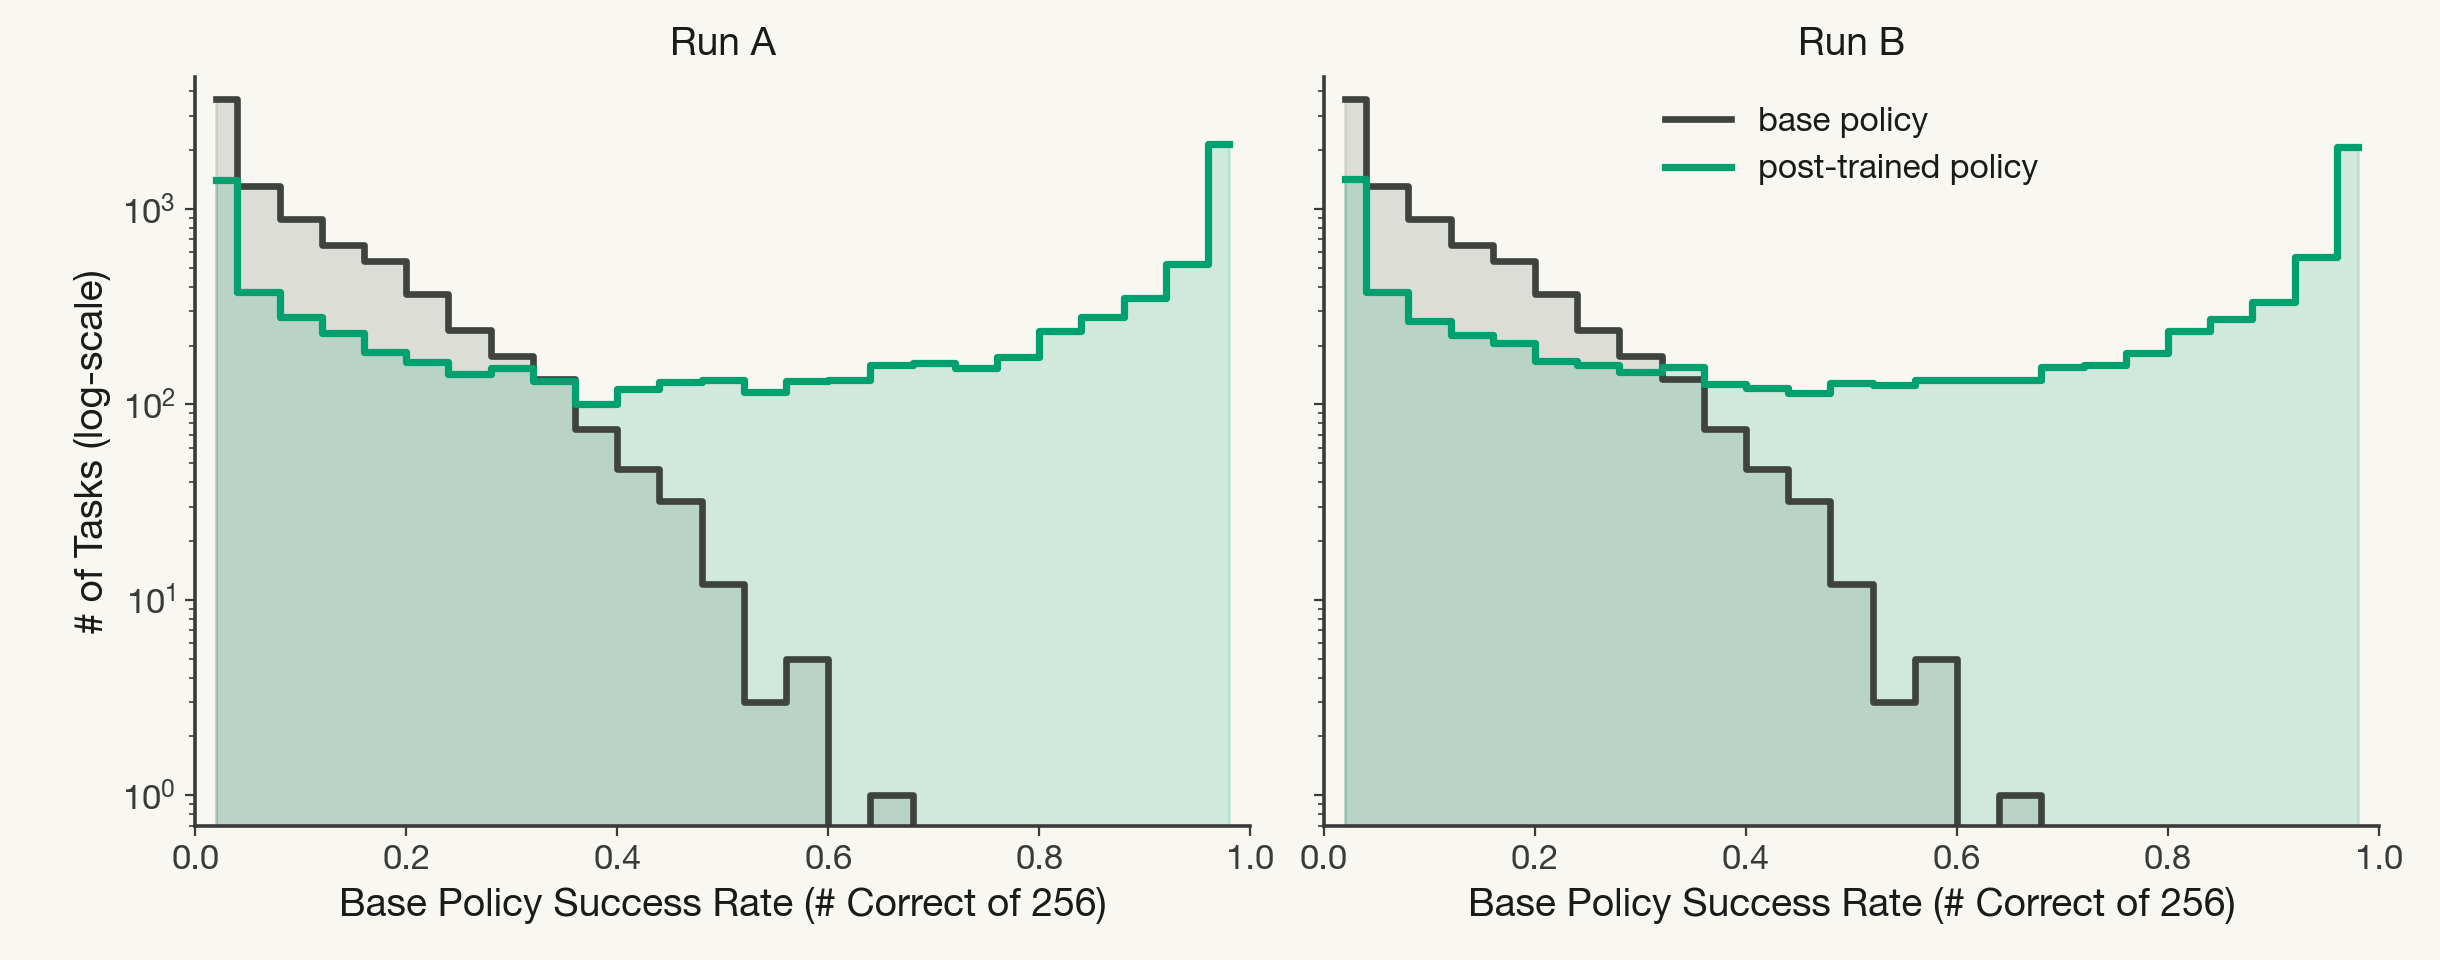
Base policy and post-trained policy success rate distribution across all 8,139 tasks.
Almost the same tasks remain stuck across runs
The “unlearnability” phenomenon holds up against this much larger evaluation sample size, and the set of tasks that are learnable vs. unlearnable is almost entirely reproducible across training runs with different seeds.
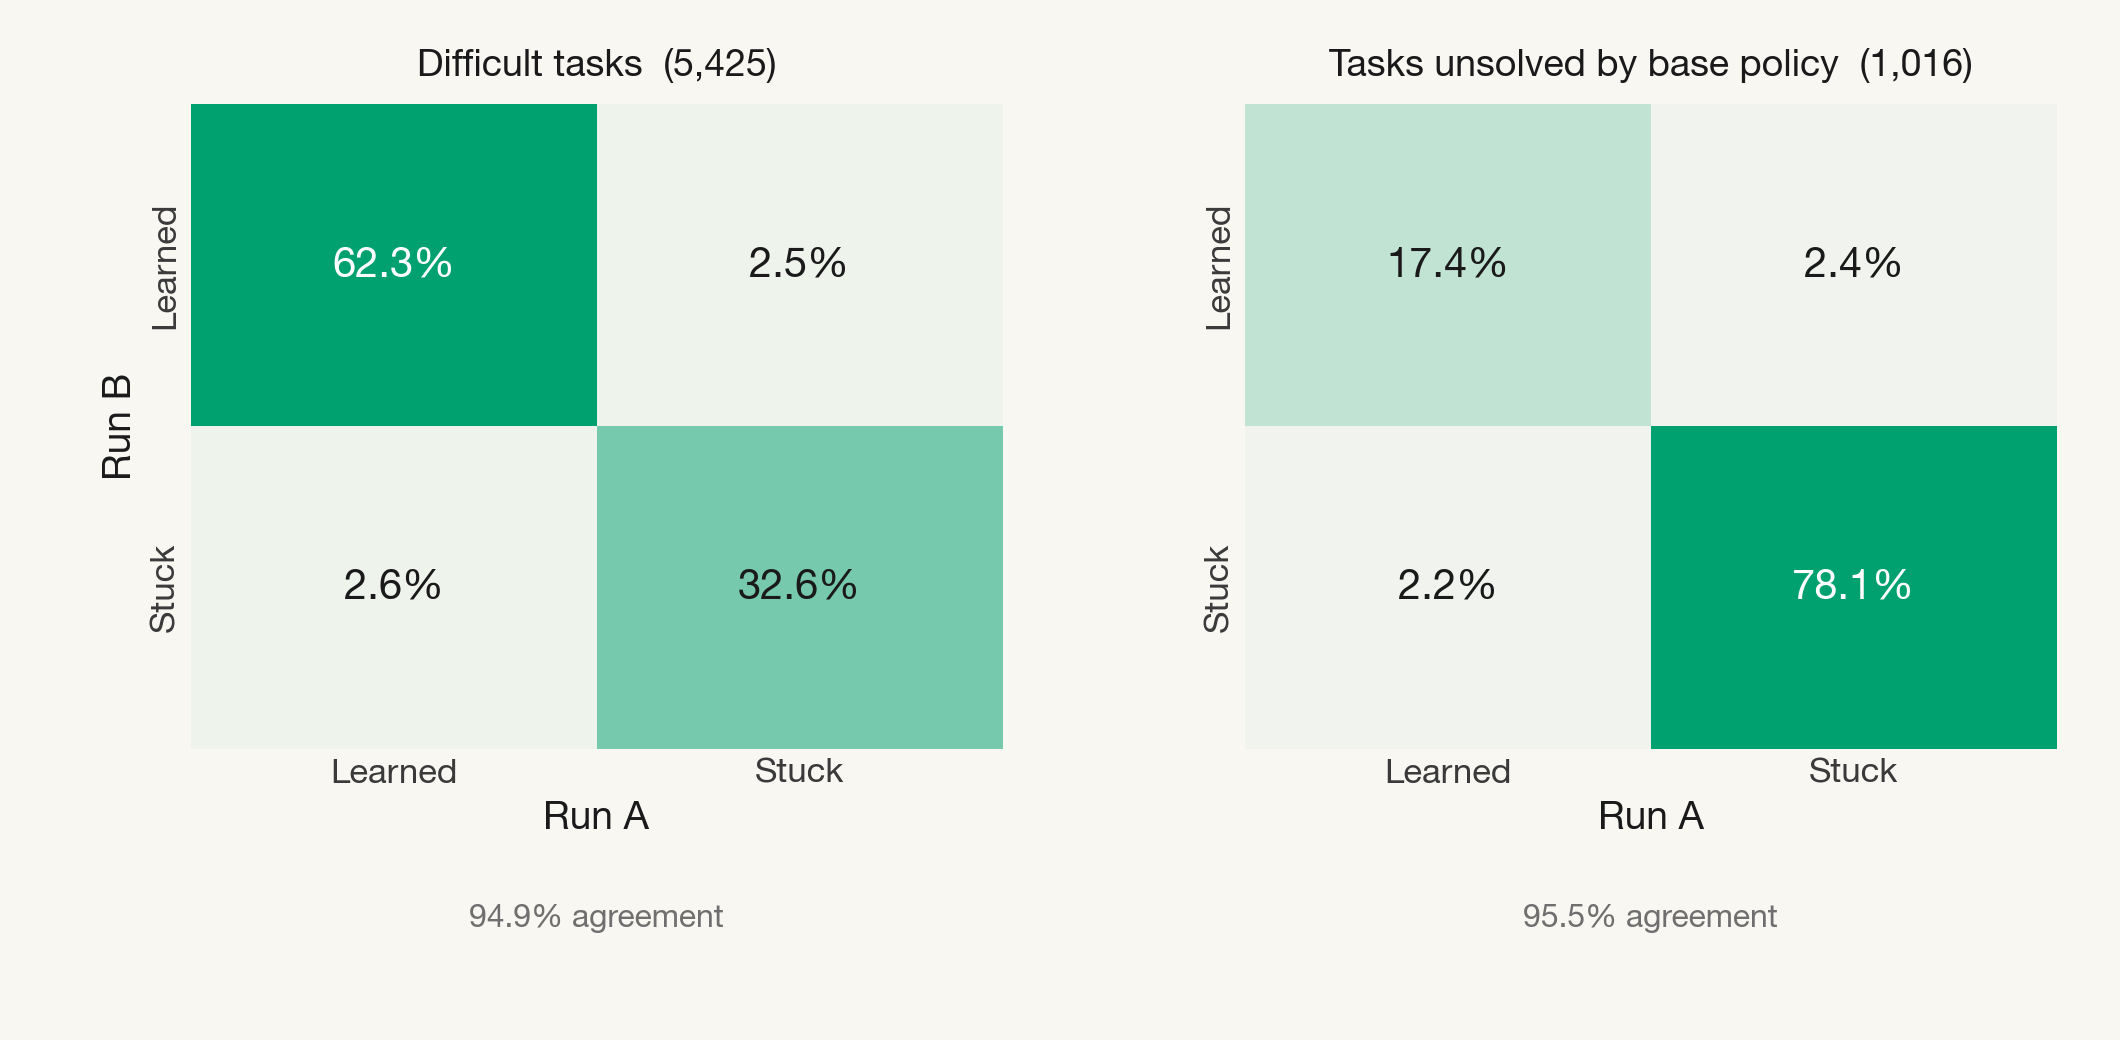
Cross-seed agreement on learned-vs-stuck outcomes for two training runs with different data order.
Consistent with [7] budget analysis, the result at 256 attempts is stable. Which tasks fall in each bucket agrees across two independent runs that saw the data in different orders. 94.9% of difficult tasks share the same outcome across runs, and 95.5% of tasks unsolved by the base model share an outcome across runs.
What can explain the difference between stuck and learned tasks? The obvious hypothesis is that easier tasks for the base model are easier to learn. In order to test the power of task difficulty in ranking stuck and learnable tasks, we compute the Mann-Whitney / ROC AUC rank statistic. Measured with 8 rollouts this AUC is 0.60, and with 256 samples it rises to 0.83; the two seeds agree, so we report one value and leave the full sweep to the appendix.
What we can learn from this is that difficulty ranks the outcomes well. However, ranking power does not imply that difficulty has explanatory power over outcomes.
So the Mann-Whitney statistic tells us tasks that start easier tend to be learned, not that two equally difficult tasks predictably share an outcome. To test whether equally difficult tasks consistently share a fate after RL, we bucket tasks by base difficulty and measure the success rate at every step. We refer to the leftmost plots as harder bands, and the rightmost plots as easier bands.
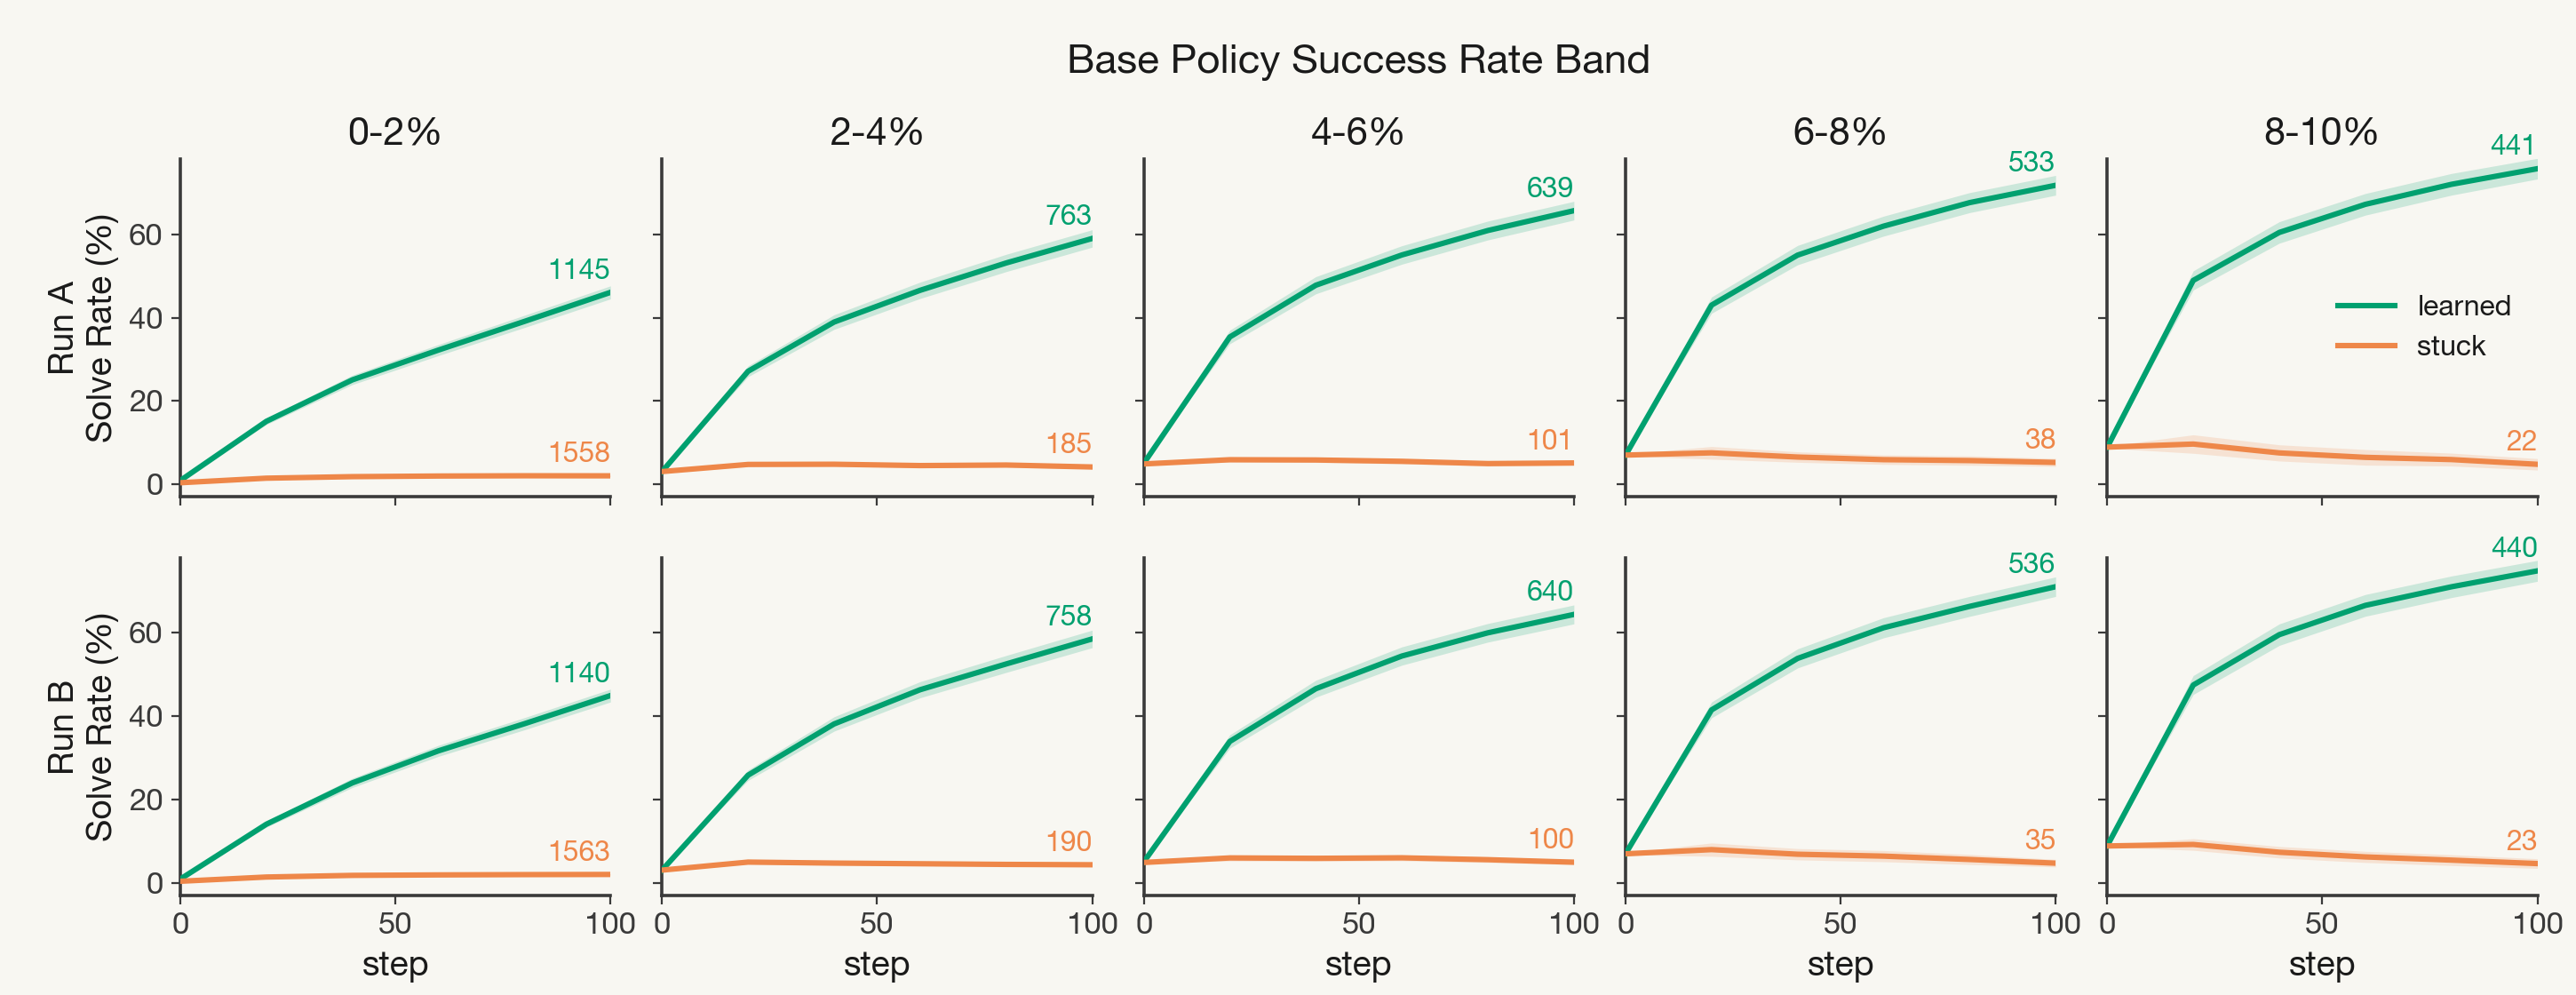
Mean solve rate over 100 steps, tasks bucketed by base difficulty (hardest band at left, easiest at right), both seeds. Bands are 95% CIs across tasks (±1.96 SEM); each task’s solve rate is itself a mean over 256 rollouts.
The above figure tells us that the ratio of stuck to learned tasks increases as you move towards harder bands. We also observe that even among learned tasks, models’ solve rates increase on tasks in easier bands more quickly than on tasks in harder bands in the first 20 steps of GRPO.
Easier bands still exhibit the “stuck” phenomenon, but far less frequently than in harder bands. Interestingly, however, pulling a task at random from the hardest band is still a coin toss between stuck and learnable. This means that difficulty does not fully explain learnability.
The hardest tasks are learned, just slowly
Evaluating at every checkpoint allows us to investigate how each task moves throughout training. The figure below plots each prompt’s gain in correct rollouts (out of 256) against its base policy success count, split by whether the task ended learned or stuck.
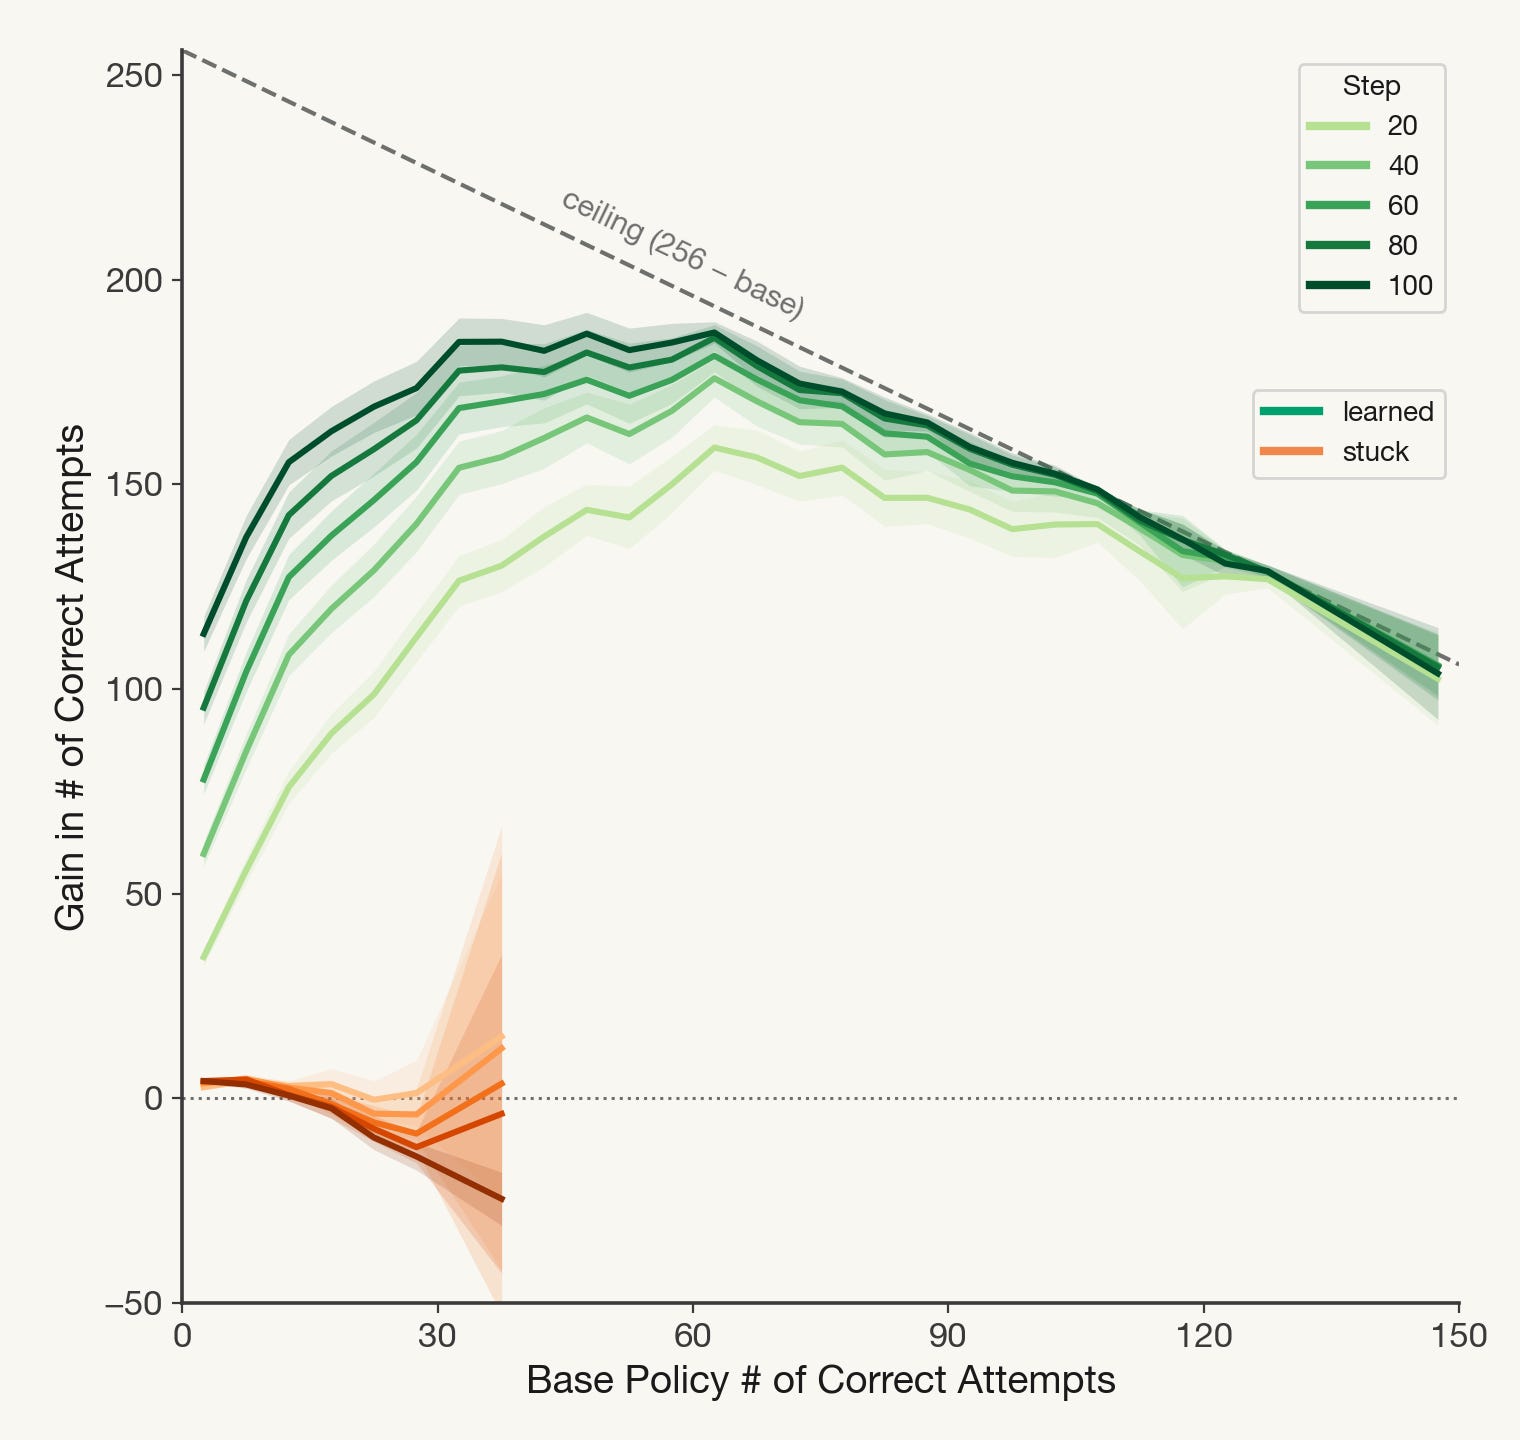
Per-task improvement (change in number correct of 256) after training vs. before, by training checkpoint, for run A. The dashed line is the largest possible gain; since we measure across 256 attempts, the maximum improvement at each base success rate is (256 - # correct by base model). Bands are 95% CIs across tasks (±1.96 SEM); each task’s gain is a difference of two 256-rollout counts.
Training continues to improve performance on the hardest tasks even after easier tasks have achieved their maximum possible gain from post-training. The hardest tasks, although clearly solvable, realize incredibly modest gains after 100 steps of training. At low base policy success rate the curves stay spread apart and are still climbing at step 100, about +18/256 over the last 20 steps. For the hardest tasks, the gap below maximum improvement seems likely to be unspent compute, not a proven limit on learnability, corroborating [7].
Tasks the base model never solves still get learned
Interestingly, even tasks the base policy never solves improve sometimes. Of the roughly 1,016 tasks that start at 0/256 correct, around 20% cross the 10% success rate threshold after training.
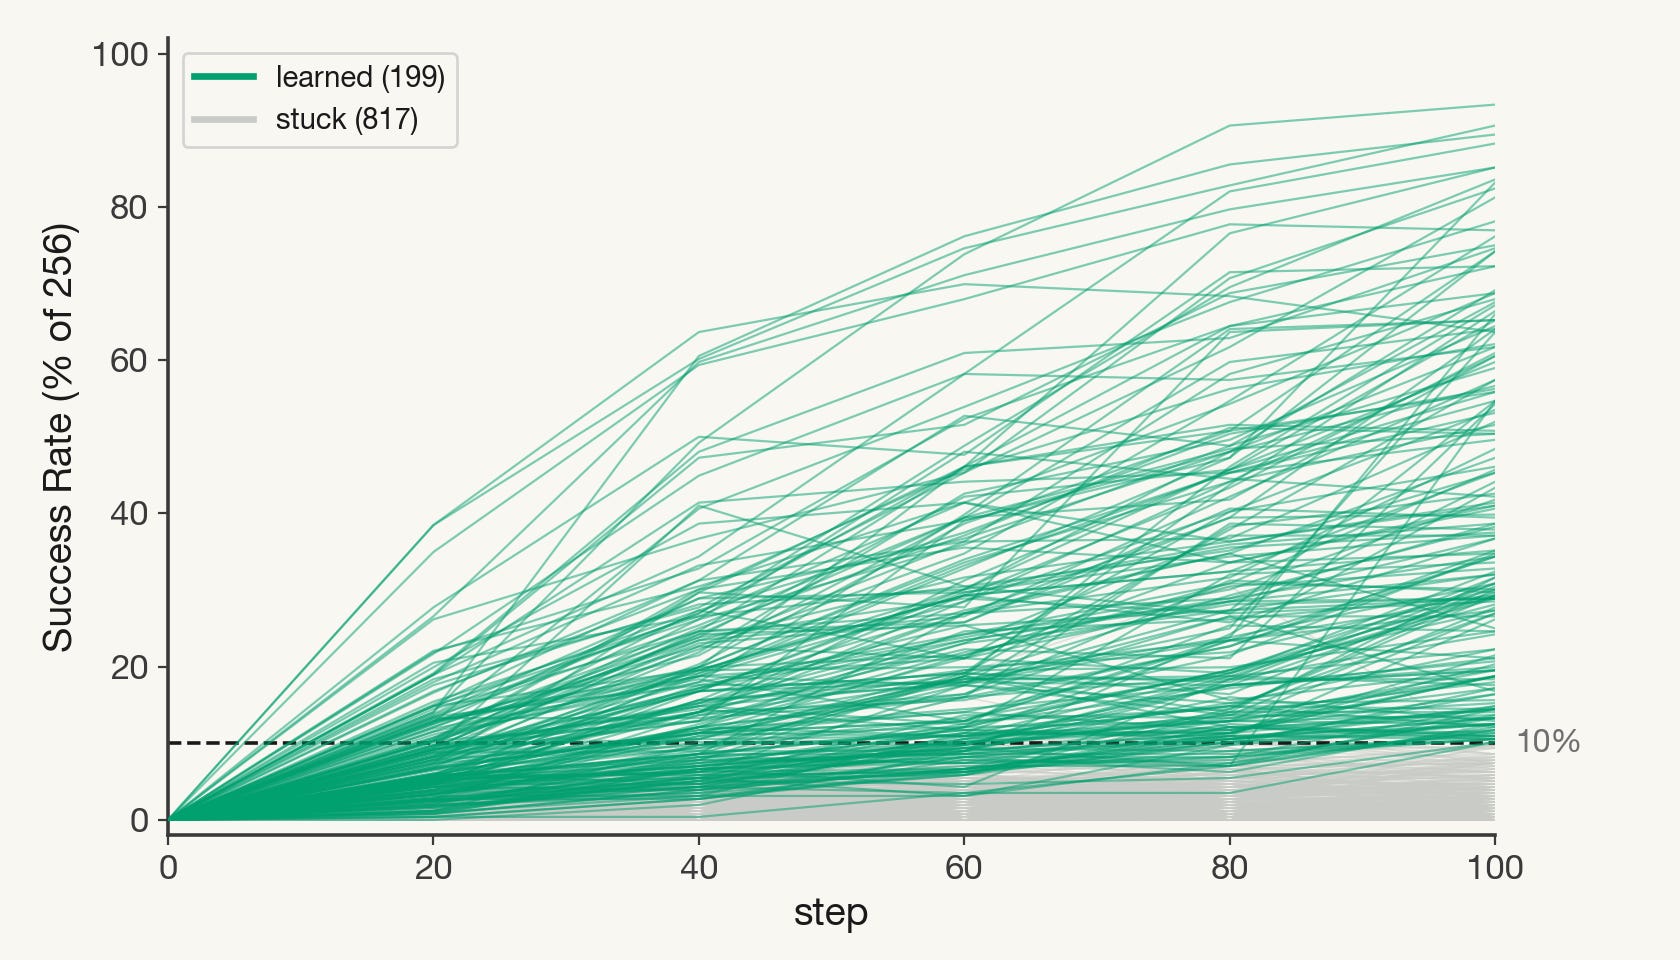
Solve-rate trajectories for the 1,016 tasks the base policy never solves (0 of 256). All start at zero; the ~20% that cross the 10% line during training are shown in green, the rest in grey.
These are the prompts a pass-rate filter drops first, but this should not necessarily be the case. There are some caveats; zero out of 256 bounds the true pass rate below about 1.2%, which is small but nonzero. We also do not yet know whether these prompts are rescued by their own reward or by what the model learns on neighbouring problems. Agrawal et al. [8] train vanilla GRPO only on problems their model never solved and find that it improves very little, which hints that weight updates from other tasks impact improvement on the ones that were originally unsolvable.
What remains is that a task for which a model produces zero correct attempts at the start is not doomed to remain unlearned, and should not necessarily be thrown out from a training run task pool.
Implications for post-training
One natural hypothesis for the mountain-shaped improvement we observed, consistent with the dependence of GRPO updates on within-group reward variation [3][4], is:
Tasks that lie above some threshold of success rate can be fully learned quickly perhaps because they receive a sufficient number of successful rollouts. Below this threshold, the improvement seen in a fixed number of steps drops off quickly.
Our observed learning dynamics are consistent with this hypothesis.
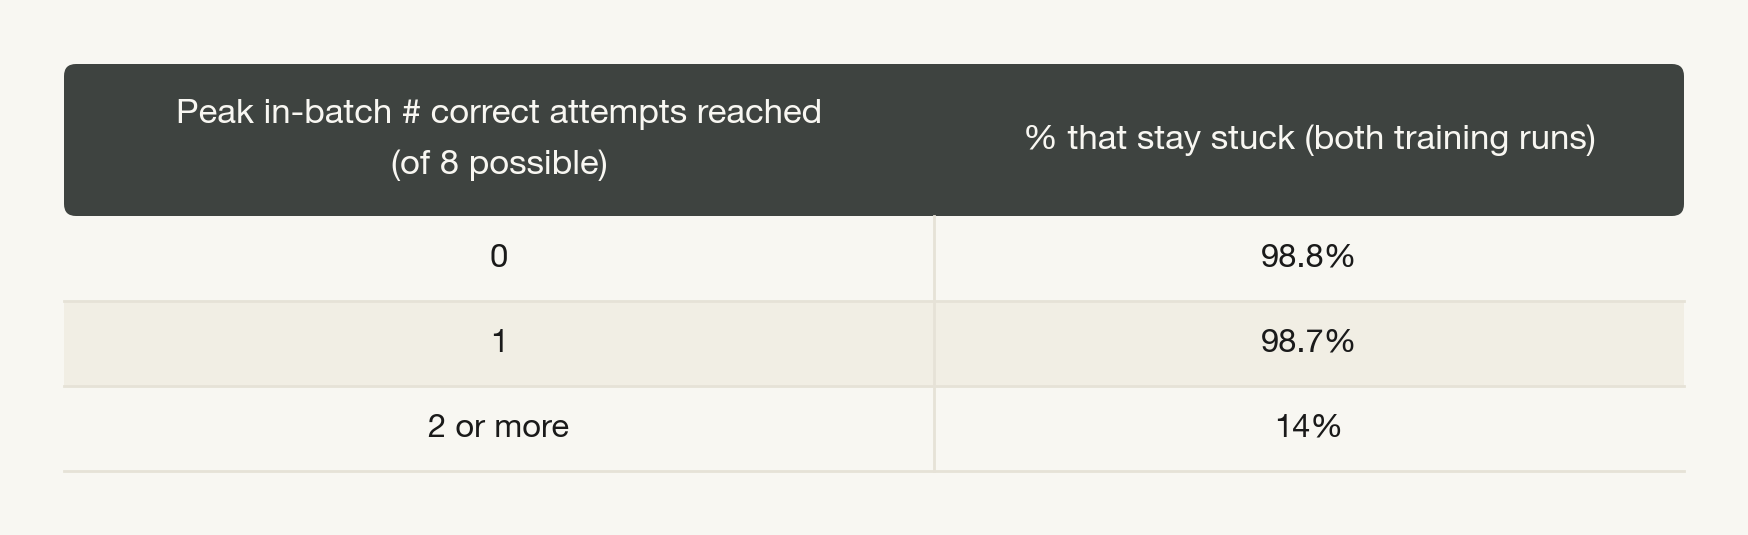
“Stuckness”, then, can’t be explained simply by an inability to ever produce a correct solution, as stuck tasks do produce correct answers during training. What predicts learning quite well is whether those correct answers ever pile up within the same training group. Of course, a task that is easier is more likely to have 2 or more attempts correct in a training batch. In order to remove the effect of difficulty, we investigate the share of tasks that end up stuck or learned split by peak number of correct attempts in training, within matched difficulty bands.
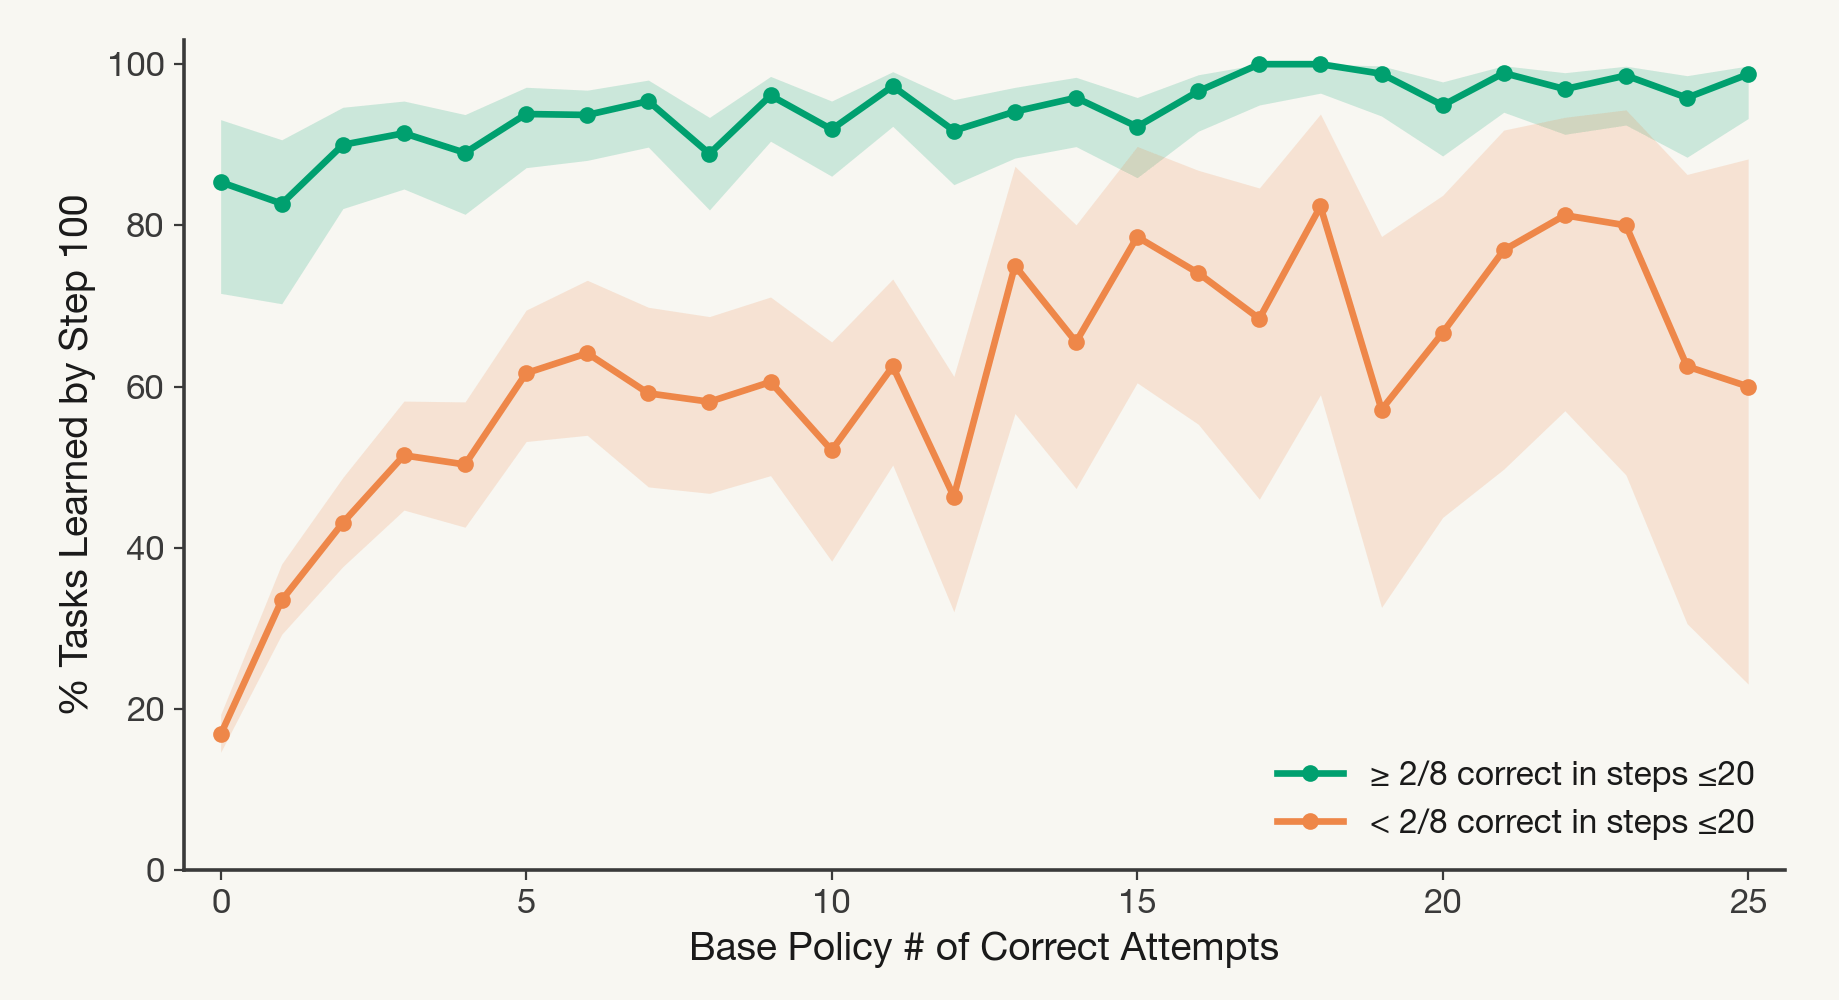
Within base-difficulty groups, final outcome split by whether a task reached at least 2 of 8 correct in a batch within the first 20 steps. At fixed difficulty, denser early signal predicts learning. Run A only. Bands are 95% Wilson CIs across tasks on the fraction learned per bin.
Among prompts unsolved by the base model, those whose groups reached at least 2 of 8 correct in the first 20 steps of training were learned 83% of the time.
These dynamics are consistent with prior work: GRPO’s learning signal peaks near a 50% success rate [3][6]. Groups with more correct attempts may also simply mark learning already under way, so giving stuck prompts extra correct rollouts is the intervention we’d want to run next. Whatever the mechanism is, 35% of hard prompts stay stuck after 100 steps for this model and recipe, and the two training runs agree on the outcome for 95% of them.
Coarse evaluation blurs this picture. Measured from 32 rollouts, starting difficulty predicts the task’s outcome with an AUC of 0.72, compared to 0.83 when measured from 256 samples. 20% of prompts with no success in 256 attempts by the base policy still get learned. That is why we measure training data with a bigger telescope: questions that look settled at low resolution are likely worth measuring again. If you train with GRPO, re-measure your hardest prompts with a few hundred rollouts before filtering them and tell us what you find.
References
[1] Chen, Yulin, He He, and Chen Zhao. “The Unlearnability Phenomenon in RLVR for Language Models.” arXiv preprint arXiv:2605.16787 (2026).
[2] Shao, Zhihong, et al. “DeepSeekMath: Pushing the Limits of Mathematical Reasoning in Open Language Models.” arXiv preprint arXiv:2402.03300 (2024).
[3] Yu, Qiying, et al. “DAPO: An Open-Source LLM Reinforcement Learning System at Scale.” arXiv preprint arXiv:2503.14476 (2025).
[4] Bae, Sanghwan, et al. “Online Difficulty Filtering for Reasoning Oriented Reinforcement Learning.” Proceedings of the 19th Conference of the European Chapter of the Association for Computational Linguistics (EACL) (2026).
[5] Bengio, Yoshua, et al. “Curriculum Learning.” Proceedings of the 26th International Conference on Machine Learning (ICML) (2009).
[6] Florensa, Carlos, et al. “Automatic Goal Generation for Reinforcement Learning Agents.” Proceedings of the 35th International Conference on Machine Learning (ICML) (2018).
[7] Chakma, Chandak, et al. “Unlearnable, or Unmeasured? On the Reliability of Difficulty Labels in RLVR.” arXiv preprint arXiv:2609.40115 (2026).
[8] Agrawal, Priyank, et al. “Off-Context GRPO: Learning to Reason on Hard Problems using Privileged Information.” arXiv preprint arXiv:2607.19313 (2026).
Appendix
A. Some stuck prompts are grader artifacts
We read model outputs, gold answer formats and the reward parser to check whether parsing could make prompts look stuck when the model was right. A few formats that Qwen2.5-0.5B produces consistently are scored as wrong by the training parser.
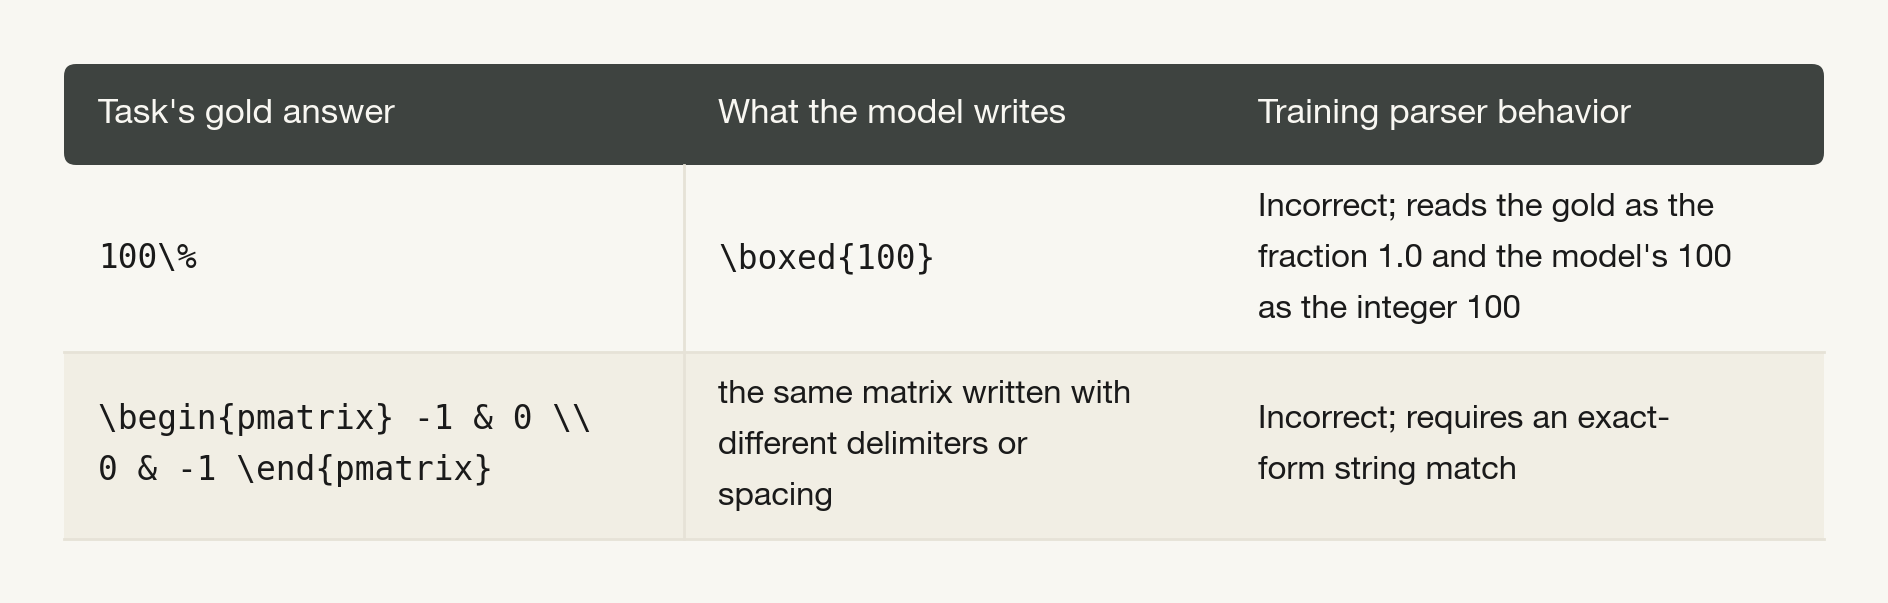
Regrading all final-checkpoint outputs with a lenient parser leaves 97.6% of prompts with the same label. The changes concentrate among stuck prompts. 190 prompts that look stuck under the training parser (about 10% of the 1,904 stuck prompts) are these format artifacts, and the model was answering them correctly all along. One example scores 0% under the training parser and 87% under the lenient one.
The training parser also scored these answers during RL, so these prompts got little or no reward for correct answers, and an artifact of this kind repeats perfectly across seeds. We therefore reran the cross-seed analysis under the lenient parser. Within narrow difficulty bands the runs still agree 91 to 96% of the time, against 55 to 79% in the coin-flip world, and the share of the spread that belongs to the prompt stays at about 96%. The parser accounts for some stuck prompts, and removing them barely changes the cross-seed agreement. Leaving out the prompts unsolved by the base policy gives the same result.
B. How robust is the difficulty result?
The AUC of base difficulty holds across choices of the difficulty threshold τ, at about 0.83 for the 10% line used in the main text, and rises as easier prompts enter the set. We fix the number of attempts used for difficulty estimate at 256 here.
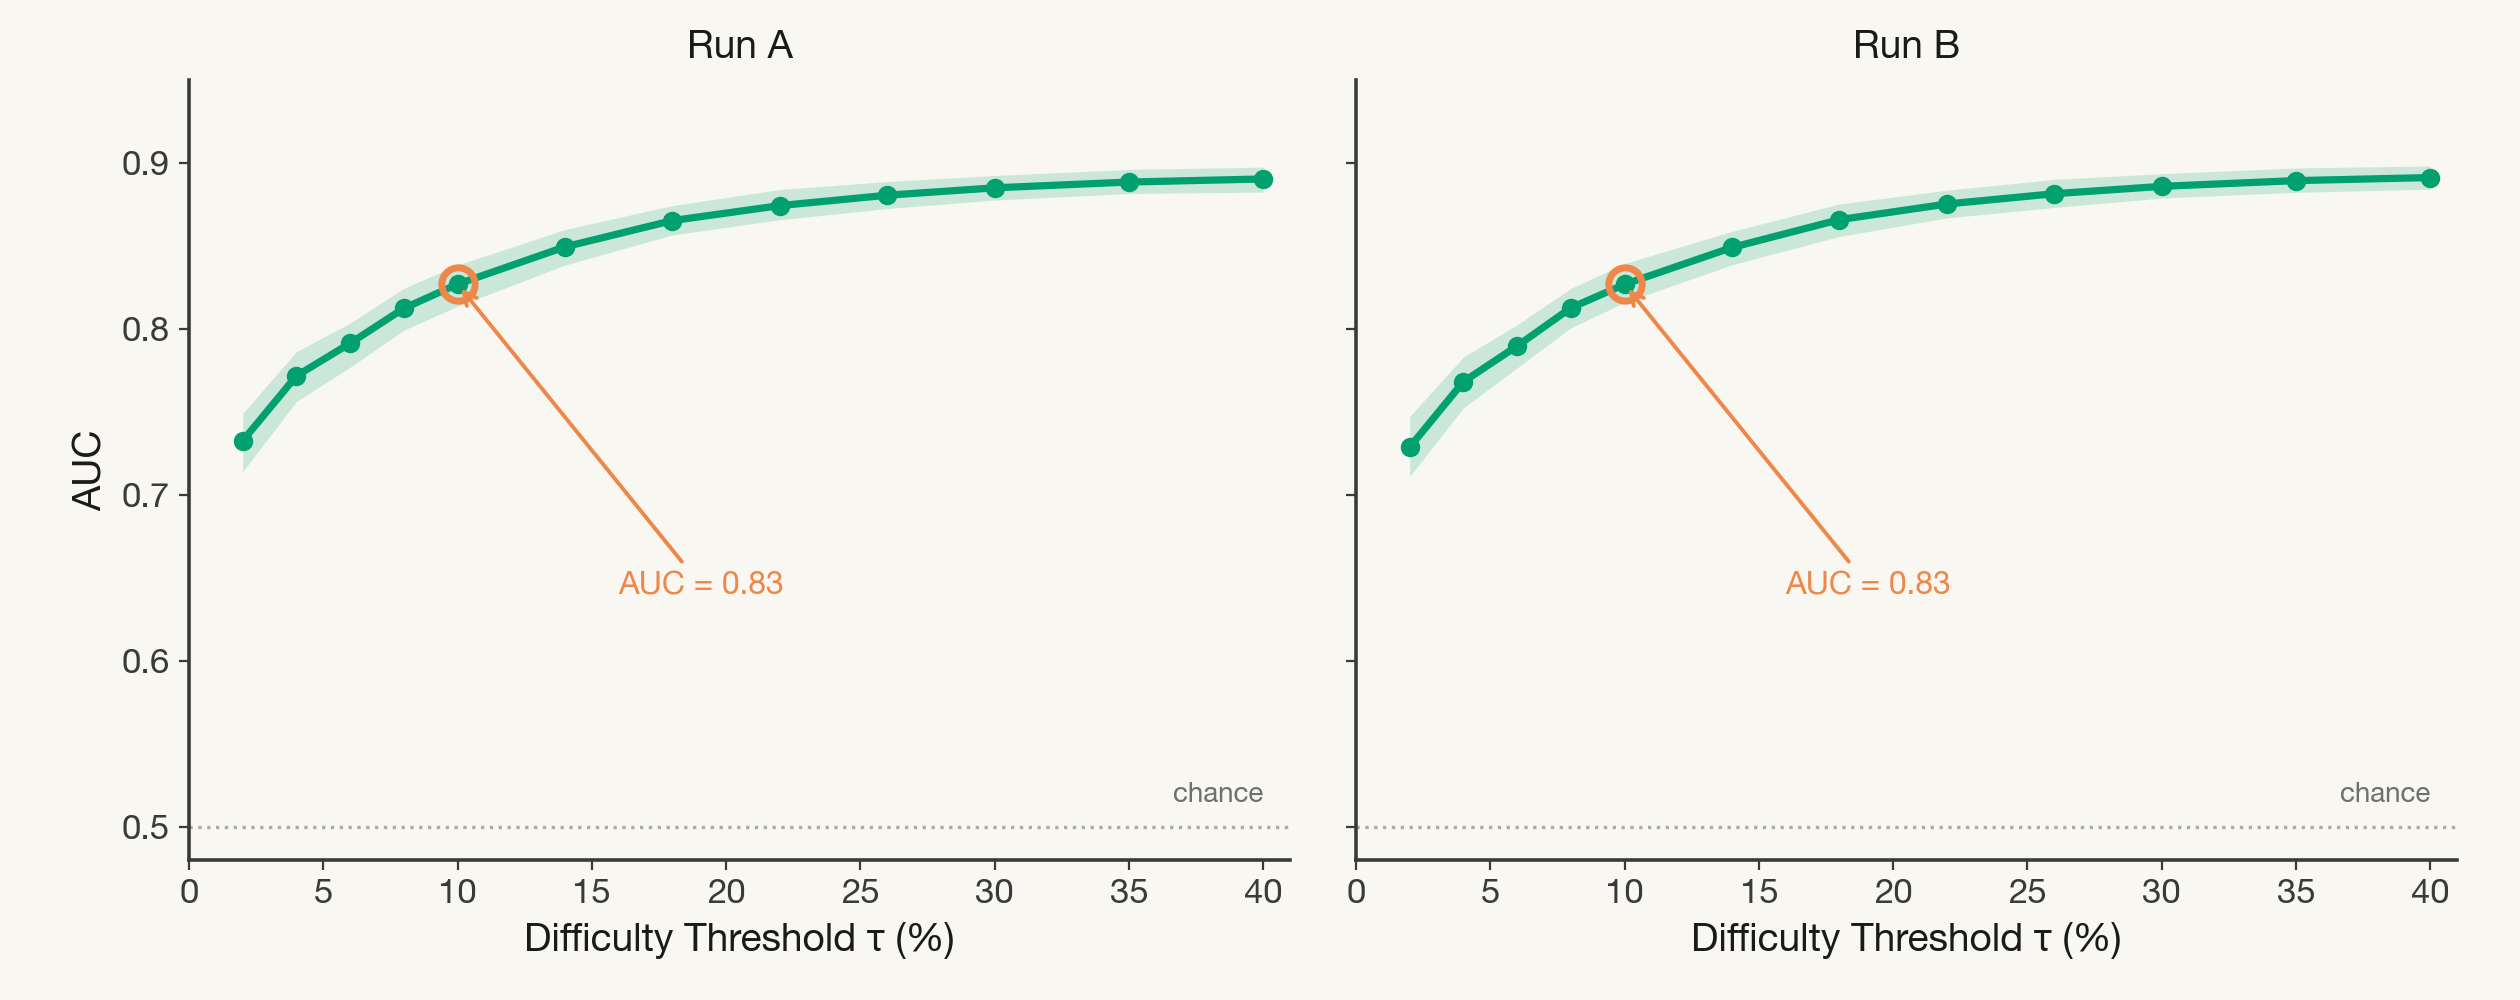
Prediction power by difficulty over stuck and learned tasks is stable. Bands are 95% bootstrap CIs across tasks (300 resamples).
The rollout budget matters far more for measuring difficulty than for measuring the outcome. In the first table we re-estimate each prompt’s base difficulty from N of its 256 base rollouts; in the second we keep base difficulty fixed and measure the final outcome from N rollouts.
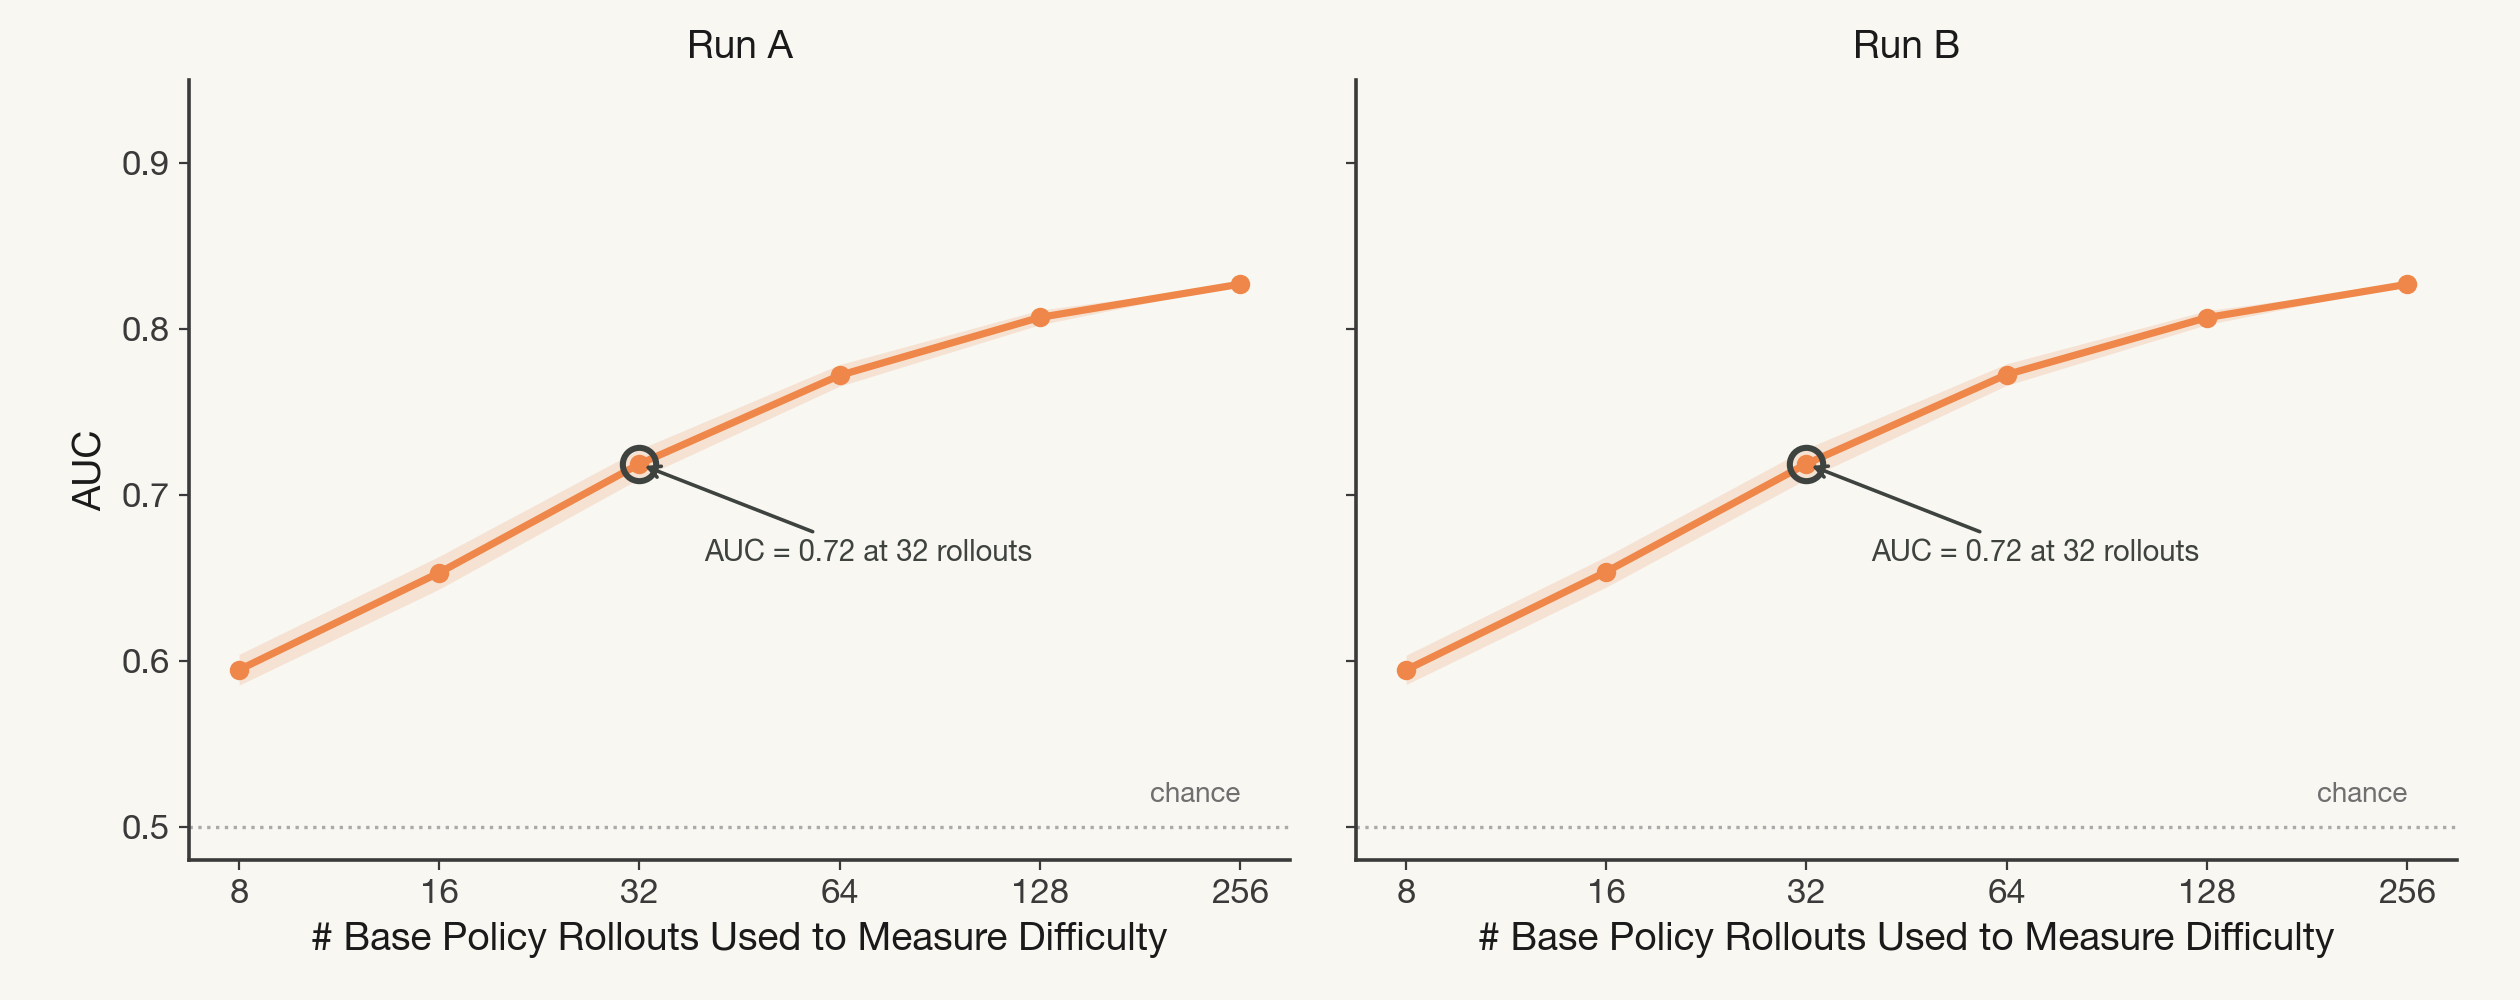
Difficulty measured from N base rollouts (run A). At 32 rollouts, difficulty predicts the outcome worse. Bands are 95% CIs across rollout subsamples (±1.96 SD over 400 draws of N-of-256); tasks and outcomes fixed.